Audio Frequency Counter
from KEUWLSOFT
Can be downloaded at Buy Me a Coffee (coffee optional).
Supporters on Patreon can find the app here .

Summary
Frequency counter based on the microphone input.
Counts when the input rises or falls past a set level and converts into into frequency or a time period.
FOR INDICATION ONLY. Results depend on your device and its hardware.
If you just want to know the frequency of a sound with harmonics (e.g. mucial instrument),
a FFT based app such as keuwlsofts spectrum analyser, harmonicity meter or guitar tuner will be better.
This app can provide more accurate frequency measurement for single frequency input signals.
Features of this audio frequency counter:
• Graph of input signal, 2.5 ms/div up to 640 ms/div.
• Gate time of 0.1s, 1s, 10s or 100s.
• Gain from x1 to x1000
• Trigger on rise or fall
• AC or DC coupling
• Settable noise level so new event is not triggered until the signal has first passed this level.
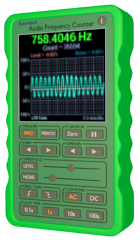
Screen shot | 
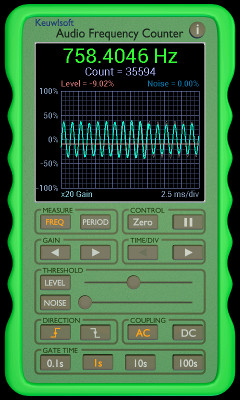
Another screen shot |
Using the App
Once loaded the app will immediately start counting events when the signal passes the trigger level threshold. The frequency or time period will be shown at the top of the display followed by a count
of the triggered events. Below the count value is a graph showing recent traces (new trace will only start on a triggered event).
The most recent trace on the graph is shown in cyan. The previous 3 or 4 traces are shown in fading grey colors to show how the signal is changing.
Below the digital display, there are 8 groups of buttons:
Measure - Select either FREQuency or time PERIOD to be displayed. Frequency is just the reciprocal of the time period:

Control - Tap Zero to reset the count. Tap pause to pause the measurement. Tap pause again to continue.
Gain - Use the left and right arrows to adjust the gain up or down. 10 different gain values are available: x1, x2, x5, x10, x20, x50, x100, x200, x500 and x1000. The current gain value is shown below the graph.
Time/Div - Use the left and right arrows to adjust the time per division up or down. The shortest value is 2.5 ms/div and since there are 8 division, the whole trace will be 20 ms of data. the time per division can be 2.5 ms/div, 5 ms/div, 10 ms/div, 20 ms/div, 40 ms/div, 80 ms/div, 160 ms/div, 320 ms/div or 640 ms/div. Note that the app will always sample at 44.1 kHz and the time/div only reflects what is displayed on the graph. Note that at 80 ms/div or above, the trace will roll across the screen. At 40 ms/div and below, the whole trace is first captured before displayed.
Threshold - Set the threshold level and noise level from which to trigger off. The trigger level value can range from -100% to 100% and is selected by the slider or from entering the value after pressing the level button. The trigger level is shown as a red horizontal line on the graph. In rise trigger mode, when the signal goes from below to above this line, an event is counted. In fall trigger mode, an event is registered when the signal goes from above to below this line. To avoid false counts due to noisy signals, a noise level can also be set. After registering and event, the signal must first pass back over the blue noise level before another count will be accepted. The noise level can be set with the slider, or the Noise button and values can range from 0 to 100%.
Direction - Select either to trigger off a rise in signal over the threshold or a fall in the signal over the threshold. Depending on the waveform shape, one direction may trigger more cleanly and give more stable results.
Coupling - Set the coupling to AC or DC. In DC mode the signal is unadjusted to that measured from the microphone input. In AC mode the long term average is removed from the signal. If your device input is not symmetric about the zero value, AC mode can remove an offset. If you want to measure very low frequencies, DC mode should be used.
Gate Time - The frequency and time period will be calculated from this length of data accumulated. If there less data that the gate time (i.e. zero pressed or app just started) then the data gathered so far is used. The gate time can be 0.1s, 1s, 10s or 100s.
Triggering
The following diagram illustrates triggering with and without the noise level:
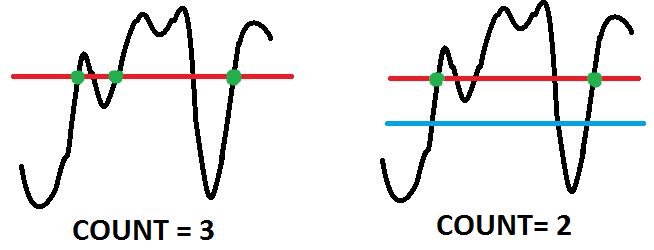
The red line is the trigger level and the green dots show where an event was triggered. In the first diagram, no allowance for noise means that for noisy signals, multiple triggered events can occur for each waveform. The second diagram shows a noise level indicated by the blue line. This blue line must first be crossed before another event can be triggered. In this case, with a suitably selected noise level, only one trigger event is registered for each waveform.
Some further consideration
The app samples at 44.1 kHz (typical audio sampling speed). The actual sample rate may vary depending on the clock speeds controlling the audio input. The actual sampling speeds are
therefore likely to vary from device to device. Temperature of the device is also likely to affect the clock speed by a small amount. The maximum detectable frequency is ~22kHz with the threshold being crossed every data point.
Finally, remember this app is FOR INDICATION ONLY. Use a calibrated frequency counter where it is required.