Accelerometer Meter
from KEUWLSOFT

Description
This app logs the accelerometer sensor data. It can output to a graph with the option of saving the data. Or transforms it into a frequency spectrum. Or even turns your device into a light or musical instrument which is controlled from the output of the accelerometer sensor.
Since Version 1.50 of the app, you can also use the linear acceleration sensor if your device has one.
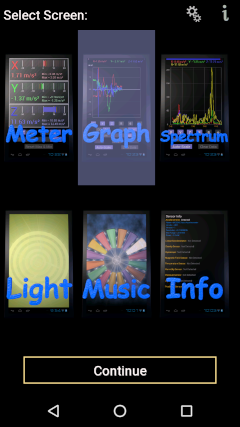
Menu screen
Start screen
Settings - The cogs button at the top of the screen. Select between accelerometer or linear acceleration sensor.
Info - Links to this user guide and privacy policy.
Select one of six options by double clicking. The
six options are:
Meter - View the real time output from the accelerometer.
Graph - To log the accelerometer output on a graph.
Spectrum - Plots the frequency spectrum.
Light - Turn your device into a light that is dependent on orientation.
Music - A musical instrument based on orientation.
Info - Specifications of sensors detected on your device.
Each of these options are described in detail below.
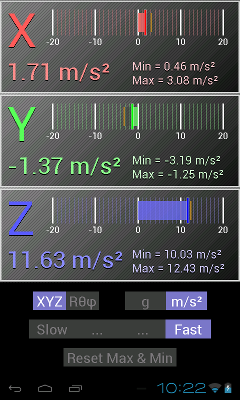
Meter screen
Meter
Displays the current accelerometer sensor output
along with the minimum and maximum values measured for each of the axis.
XYZ / Rθφ - Selects if the acceleration vector is
presented in cartesian of spherical coordinates.
g or m/s² - units of acceleration can be selected to be either m/s² or g.
On earth g = 9.81 m/s².
Slow ... Fast - Select the speed at which the accelerometer returns data.
Reset Min & Max - This resets the minimum and maximum values.
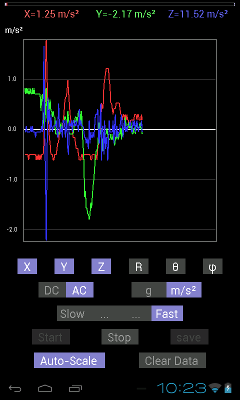
Graph screen
Graph
This screen allows you to log and save the data from the accelerometer.
The progress bar at the top shows the amount of memory used relative
to the total set aside (20000 data points).
The red marker shows the current position of the data being logged. If the memory is full it will wrap around and start overwriting the earliest data.
The lighter part of the progress bar shows the data currently plotted in the graph below.
Below the progress bar are the latest readings for each of the parameters shown in the graph.
The graph has up to six lines depending on the parameters(X Y Z R θ φ) selected in the controls below.
Each line has its own unique color as indicated by the latest reading above the graph. The left y-axis are for acceleration values. The
right axis is for degrees. With autoscale on,
the latest readings will be shown and the y-axis adjusted to accommodate the data.
By pinching the graph in the x-axis, the graph can be made to show more or less data pints.
While paused you can slide back the graph to see earlier data.
. With autoscale off, the y-axis can also be zoomed in and moved out as desired.
Controls:
X Y Z R θ φ - Select which parameters are displayed on the graph.
DC/AC - DC or AC coupling. In AC mode, the long term average is removed from each reading.
g or m/s² - Select units of the measured data.
Slow ... Fast - Select the speed at which the accelerometer returns data.
Start - If the logging is paused, click here to restart.
Stop - Stop/pause the logging. The logging has to be paused in order for data to be saved.
Save - Save the data in a comma delimited text file containing Time,X, Y, Z, R, θ and φ. The file is saved
with filename "Accelerometer Data YYYY-MM-DD HH-MM-SS" where YYYY, MM & DD are the Date and HH-MM-SS gives the time. The location of the file is in the documents folder, in a keuwlsoft/accelerometer sub directory. For older app versions (Version 1.40 and below) the files would have been saved within the root directory, possibly inside a keuwlsoft folder.
AutoScale - The y-axis is auto scaled if this is on. If it is off, pinching the graph will scale it accordingly.
Clear Data - Clears the recorded data so you can start a new test.
Sample data file with 2 data points:
Keuwl Accelerometer Data File
2015-11-22 21-21-33
Time (s), X (m/s2), Y (m/s2), Z (m/s2), R (m/s2), Theta (deg), Phi (deg)
0.0000000,-0.340512,0.340519,9.684077,9.696035,2.846823,135.000000
0.1401100,-0.381373,0.340510,9.684078,9.697554,3.022132,138.239700
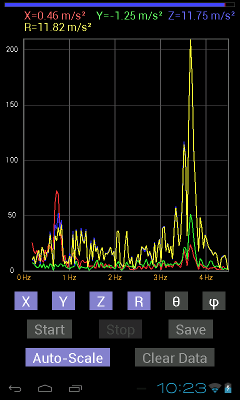
Spectrum screen
Spectrum
This screen allows you obtain the frequency spectrum from the recent accelerometer data.
The progress bar at the top shows the memory used for doing the frequency spectrum. The data is weighted towards the most recent data.
The marker shows the progress of the sampling through this memory. The data is first interpolated and re-sampled before a FFT is performed.
The frequency range of the Fourier transform is
selected based on the sampling rate. Thus the frequency range will vary
between devices but should represent the best for that device.
Below the progress bar are the latest readings for each of the parameters shown in the graph.
The graph has up to six lines depending on the parameters(X Y Z R θ φ) selected in the controls below.
Each line has its own unique colour as indicated by the latest reading above the graph.
The y-axis shows the magnitude of the signal at that frequency. Units are arbitrary.
With autoscale on, the y-axis adjusted to accommodate the data, otherwise pinching or touching the screen will allow you to move around and zoom in the data as required.
Controls:
X Y Z R θ φ - Select which parameters are displayed on the graph.
Start - If the Logging is paused, click here to restart.
Stop - Stop/Pause the Logging.
Save - Save the data in a comma delimited text file containing frequency in Hz and the parameters selected.
The file is saved with filename "Accelerometer Spectrum Data YYYY-MM-DD HH-MM-SS" where YYYY, MM & DD are the Date and HH-MM-SS gives the time. The location of the file is in the documents folder, in a keuwlsoft/accelerometer sub directory. For older app versions (Version 1.40 and below) the files would have been saved within the root directory, possibly inside a keuwlsoft folder.
AutoScale - The y-axis is auto scaled if this is on. If it is off, pinching the graph will scale it accordingly.
Clear Data - Clears the recorded data so you can start a new test.
Sample data file with first 2 data points shown:
Keuwl Accelerometer Frequency Spectrum Data File
2015-11-22 22-10-05
Frequency (Hz), X, Y, Z, R
0.9406578,87.9794846,45.2509041,51.8141022,19.8725300
1.1287893,49.6402512,12.1695557,32.4627113,10.2420321
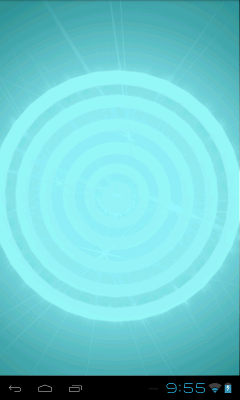
Accelerometer Light
Light
Based on the accelerometer sensor, the colour of the light changes with the orientation of the device. Could be waved from side to side at a music festival for a cool effect.
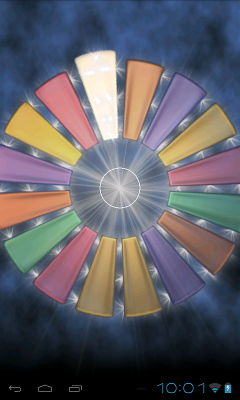
Music screen
Music
A five note per octave equal tempered musical instrument. To play, rotate your device to select the note.
The volume is indicated by the size of the circle in the center and is controlled by the pitch of your device.
Hit the back button to return to the main menu.
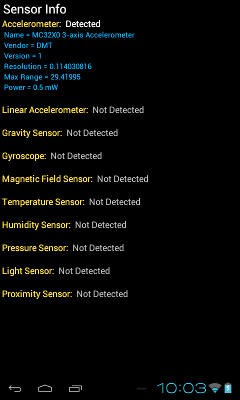
Info screen
Info
This screen displays specifications for the sensors detected on your device. It lists the internal name given to the sensor, the vendor, version number, resolution, max range and power (in mW) used by the sensor.Slide the screen down if the info doesn't all fit on the screen. Hit the back button to exit and return to the menu screen.